| Key | Name | Labels | Description | Attachments | Status | Resolution | Current Environment | Dates |
|---|---|---|---|---|---|---|---|---|
| ITD-23 | PDF update 2025 - version 3 for https://report.innerteamdialogue.com/ |
*CORRECTION:*
I moved the new "COPY OF..." sheet so that...
*CORRECTION:*
I moved the new "COPY OF..." sheet so that the first two sheets will still populate the two versions of the report that are active now. When we are ready to go live, Max - you'll have to direct the ORIGINAL version to the third tab, the 12-17-24 version to the second tab, and the NEWest version to the first tab. Here's my email with this correction: Hi Max and Joel: I understand you did meet tonight, thank you! Joel mentioned that you were thinking of using the incorrect tab in the active spreadsheet - do not use the one called "special - ordinary test results." That was just for Paul and me to test the wording. *IMPORTANT: Spreadsheets to Access when we go live:* *https://docs.google.com/spreadsheets/d/1ztZFBTeidBZkx8Ls6lVAR0n_hYMEfm2s4hrGXJBzMCk/edit?usp=sharing* * *For the new version, you will use the VERY FIRST tab*, which I'm going to rename when we are ready to populate it with the new wording and data. * Right now, it says "Assessments 12-17-24." ** * *I cannot change anything in that tab until we are ready to go live.* * *Until we go live, any completes using the current version will still show up in this first spreadsheet.* * Once we are ready to go live, The SECOND tab will be named Assessments 12-17-24 (right now, it is the third tab and it says "Copy of...."). * I put the current data there, but I just realized you need it to be in the first tab in case anyone needs to access a complete from earlier. (So I put all of that data back for now). * At the moment, the completes for this version (12-17-24) are in BOTH the first and third spreadsheet. * I'll delete everyone from the first spreadsheet once we go live. * I cannot delete them yet because we need them for current completes right now and we need to be able to find them in the second sheet as soon as we go live. I'll add any new completes there when we do. * The THIRD tab will be named Assessments - this will still have the original version. * *RIGHT NOW, I left it as the second tab so we can still access those reports.* * *You will need to redirect the original completes to the third tab once we go live.* I also explained that I had already circled the pages in the current report that are changing. You'll see that HERE: https://drive.google.com/file/d/1dscnYnnnioGnaNkl6g4ydSYeUCdfr0uP/view?usp=sharing Joel is creating a copy of his v15 that has the same sections circled so you can see the new version. ============== FROM EMAIL ========== Max This is the PDF we reviewed with comments added where Special and Ordinary icons and text were updated. https://drive.google.com/file/d/13qxlA2oO7ruUmdVUFmlRuJ5HXrfPVY8a/view?usp=sharing Ellen’s Google Drive folder has the Special and Ordinary icons and images exported as PDF, SVG and PNG: https://drive.google.com/drive/folders/1QyUSS92BQBiHseRhWRef488zWCKUpSL3?usp=drive_link I attached them here as well. ===================== |
|
To Do | Unresolved | -- |
|
|
| ITD-22 | correction on location of old measures being replaced |
|
In my description of the task we are preparing to do, (chang...
In my description of the task we are preparing to do, (changing the wording of four measures and feeding the scores into the tables on those pages in the PDF report), I gave you the wrong "old" columns. Instead of Columns I, BS, CL, and CO, we will actually be replacing I (that one was correct), Y, AU, and AX. I have mocked up the new columns in the Google Sheet and identified the ones we are replacing.
|
To Do | Unresolved | -- |
|
|
| ITD-21 | UPDATE to request for estimate |
|
I noticed that one of the screenshots I just sent was incorr...
I noticed that one of the screenshots I just sent was incorrect. Please see attached for "New Wording", now called "screenshot...". One of the columns did not have the old wording spelled out for you.
|
|
To Do | Unresolved | -- |
|
| ITD-20 | Change four measures in PDF Report for Inner Team Assessment |
|
*Please give an estimate on the following:*
-----
Change t...
*Please give an estimate on the following:*
----- Change the wording of four measures and pull the scores from four new columns in the spreadsheet. I should have the new measures for you during the week of August 26, 2024 We need to be ready to implement very quickly once I make the changes in the assessment itself (in involve me). - Once I change the assessment, the new measures will immediately replace the old ones, but the old columns will stay in the spreadsheet (so we can compare). So, we should set up your PDF (in development mode), then turn on the assessment changes, then turn on the new PDF maker. You will pull the numbers and averages from a different column for four measures. The old columns will be blank for new completes - you'll need to point the PDF graphs to the new columns and turn it on right away. You will change the wording in the PDF report to match. (I hope it's clear that the text will change on the pages I sent AND the GRAPHS also need to pull the scores from the new columns). --- update; I noticed that one of the screenshots I just sent was incorrect. Please see attached for "New Wording", now called "screenshot...". One of the columns did not have the old wording spelled out for you. |
|
To Do | Unresolved | -- |
|
| ITD-18 | an immediate minor change to the PDF Report (add link) |
|
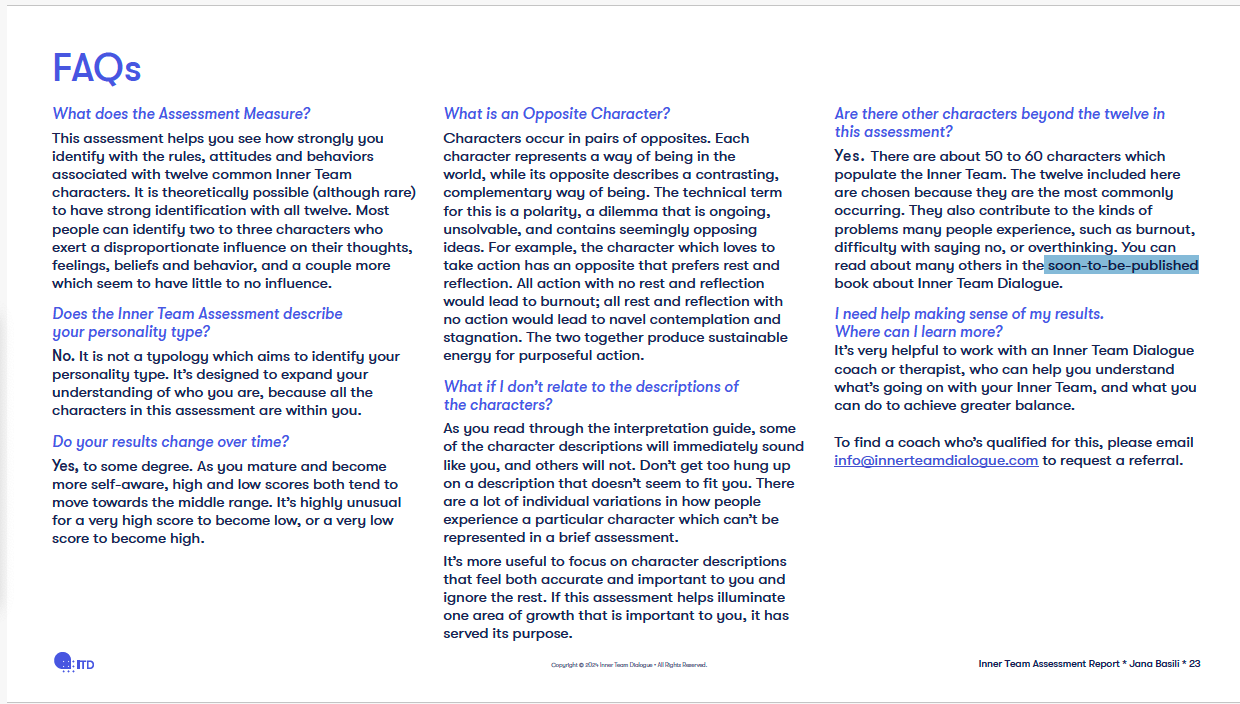
On Page 23, under FAQs, righthand column, near the bottom. ...
On Page 23, under FAQs, righthand column, near the bottom. Instead of "soon-to-be-published," it should say "recently published" and if you can link it to the same Amazon page the book is linked to on Page 22, that would be great:
Amazon link when I click on "order now" on page 22 is: https://www.amazon.com/dp/B0D38XGQ9P?ref_=cm_sw_r_cp_ud_dp_P01Q8R2MYWVHR97P0VKN_2&skipTwisterOG=1 |
|
Done | Done | -- |
|
| ITD-17 | store the pdf file, and store into the last column |
|
After the URL is triggered, generate the PDF and store the D...
After the URL is triggered, generate the PDF and store the DF on the server.
Write the URL to the PDF file, into the Google Sheet (in the last column). Each time the PDF is generated, the static PDF file will be re-saved on the server. Column name is DC / PDF file in the google sheet. File should be stored as follows: client_name_date.pdf Joel_Tachau_06-24-2024.pdf (real example) |
Done | Done | -- |
|
|
| ITD-16 | Add [ &Date=2024-06-04 ] variable as option to pull the PDF spesific to that date |
|
Add an additional variable to the URL.
&Date - will be an ...
Add an additional variable to the URL.
&Date - will be an optional variable. If the variable exists, then the system should pull the data from Google Sheet only for that date and email. |
|
Done | Done | -- |
|
| ITD-15 | Minor update - june 5 |
Max, perhaps you didn't see the first email I sent to Joel, ...
Max, perhaps you didn't see the first email I sent to Joel, cc to both of you, where I realized that the charts are correct. Joel needs to decide if he wants to change Page 9. (I realized that the difference scores just on that chart LOOK like they are plotted, so the difference of "2.7" shows in the same place as the average score of 3.7 on the scale.) So my suggestion is to just change Page 9, where the difference numbers are not discussed, but keep the difference number on all the subsequent detail pages. I sent the second email when I noticed that I had quoted a different report in my email. Here is the corrected original suggestion, with page numbers and screen shots!
*** AHA! I think these graphs and numbers are actually perfect. What threw us off is that the DIFFERENCE score is posted right on the chart. So the "2.7" scores look like they are plotting in the same place on the scale as the "3.7" average ratings. Joel: What do you think about taking *the balance scores off the chart, just on Page 9?* So it would still show "Pusher 1" and "Being 3.7" but the 2.7 would not be visible. (image #1) *Then, you can KEEP the* *2.7* *on the detail page*, where you do talk about what that gap number means. (image #2 ) |
|
Done | Done | -- |
|
|
| ITD-14 | Balance Score charts issues - Joel Tachau has shared a file with you |
Something off with Balance Score charts p 9, 14, 18. The 1s ...
Something off with Balance Score charts p 9, 14, 18. The 1s are showing (ty) but Responsible Playful and Rational Feeling are off. The dashed lines at 2.3 and 3.7 are still missing. P.9 chart title is "Your Balance Scores."
https://acrobat.adobe.com/id/urn:aaid:sc:US:0ce6c1a5-4783-4ac1-b6dc-d887366da797 |
|
Done | Done | -- |
|
|
| ITD-13 | adjustments - 5/25/2024 |
Hi Max,
Thanks for adding the buttons. They look good and...
Hi Max,
Thanks for adding the buttons. They look good and work well. Please fix these last few things: * P. 7 Polar chart should be behind the Character Icons. * P. 8 and P. 9 charts should have dashed lines at 2.3 and 3.7 in background as on p. 6 Balance Scores chart * P. 9 Chart Title is “Your Balance Scores” * 1.0 is “0”, the Y axis, and if someone actually scores 1.0 (unlikely) the mark should appear on the chart. On the attached PDF, a 1.0 for Expert is missing on p. 9 and p. 20. * Learner 5.0 should be all the way on the right on p. 9 and 20. So the whole balance chart is skewed to the left right now. * On the latest test PDF I shared below, the Pleaser, Feeling and Learner marks should be on the 2.3 dashed line you add in the background and the Boundaried, Playful, Rational and Expert marks should fall on the 3.7 dashed line you add to bkgd. * P. 22 We noticed that “order your copy” is stretched vertically. Here is the latest InDesign Publish Online Report: https://indd.adobe.com/view/38f42a1e-3824-4038-b9e6-a2b7004fd52e Here is the PDF: https://acrobat.adobe.com/id/urn:aaid:sc:US:61d4f829-24f4-47df-9aaf-2977b48b6f1c Can we also set the initial view for the PDFs to *Single Page Continuous, Fit Width*? This makes it easier to just scroll through the report. Thanks! Joel |
|
Done | Done | -- |
|
|
| ITD-12 | updated version 12.2 - with images as buttons |
I fixed the buttons in InDesign and exported new PDFs where ...
I fixed the buttons in InDesign and exported new PDFs where they work.
Also providing images. (attachement) https://acrobat.adobe.com/id/urn:aaid:sc:US:3fdc22f7-ff52-4d8a-b86a-ebbc3a796930 https://acrobat.adobe.com/id/urn:aaid:sc:US:74f0ab33-3c7e-43d6-a6cb-4c728fb3d3d2 |
|
Done | Done | -- |
|
|
| ITD-11 | minor updates - may 13th |
But the changes on p 2 and 3 for example haven’t been made....
But the changes on p 2 and 3 for example haven’t been made. The answers are wrong on p. 12…
So the PDF is generating with the correct scores but the changes I listed havent been made. Max, please make sure these changes/corrections are made. I sent them earlier but they aren’t done. Desktop assessment report design. https://acrobat.adobe.com/id/urn:aaid:sc:US:8fcae0c6-6971-43a0-b46c-86bdac55daec Changes below are also comments in PDF. * *PDF Initial View settings:* * Navigation tab: Bookmarks Panel and Page (latest PDF has bookmarks) * Page layout: Single Page * Magnification: Default * *P. 2 and 3 update as shown on latest PDF*: https://acrobat.adobe.com/id/urn:aaid:sc:us:5ed192b1-eec9-418a-8cb4-526e6623c2d2 * *P. 5 Heading* is "Understanding Your Assessment" * *P. 7 Polar Chart Summary:* Good catch on not being able to have the donut hole since low scores will display there. * Polar Chart colors: * Pusher - Being: #4756CC80 * Pleaser - Boundaried: #2E90B280 * Responsible - Playful: #F28C4A80 * Perfectionist - Messy: #20265965 * Rational - Feeling: #F25B4A80 * Expert - Learner: #64625D80 * Expert - Learner icons and text are reversed. * Character Circle Icons should be in front of chart. They have a white border in case they overlap a chart wedge (see example where Playful is 5). * Character scores can be further away from outer edge or wedge so the circle icons do not obscure them. * *P. 8 Bar chart colors are the same as polar chart colors, add dashed lines at 2.3 and 3.7 behind bars.* * *P. 9 Your Balance Scores: add dashed lines at 2.3 and 3.7 behind bars*. * *P. 11* “You can address overuse…” sentences italicized * *P. 12 Your Answers statements should match latest PDF.* Add space after low balance score paragraph. * *P. 13 “*You can address overuse…” sentences italicized * *P. 14 Your Answers statements should match latest PDF.* Add space after low balance score paragraph. * *P. 15* “You can address overuse…” sentences italicized * *P. 17* “You can address overuse…” sentences italicized * *P. 18 Your Answers statements should match latest PDF*. * *P. 19* “You can address overuse…” sentences italicized * *P. 20 Your Answers statements should match latest PDF*. * *P. 21* “You can address overuse…” sentences italicized * P. 22 Missing buttons at bottom of each column. See latest PDF. Thanks for all your work on this! LMK if you need anything or have questions. |
Done | Done | -- |
|
||
| ITD-10 | Latest version is not being accessed |
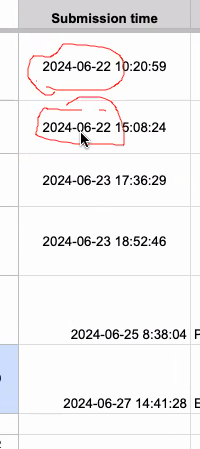
When there is more than one entry, it pulls the earlier one ...
When there is more than one entry, it pulls the earlier one instead of the latest
|
Done | Done | -- |
|
||
| ITD-9 | Redirected completes yield an error message: "Such combination does not exist" Same message whether we say yes we are a coach or no we are not - with a coach email |
Redirected completes yield an error message: "Such combinati...
Redirected completes yield an error message: "Such combination does not exist" Same message whether we say yes we are a coach or no we are not - with a coach email
---- It was working earlier yesterday. Ellen removed all of the previous Google sheet entries to make sure we could see the current version. Not sure if that was before or after it stopped working ------------ 5-9-24 PARTIALLY completed! When the respondent has never taken the survey, it is now working to download the most recent one, but there are three issues remaining (see below)… Issue #1: The version is not Joel's most recent version. Issue#2: When someone takes the survey a second time, the program does NOT pull up the newest compleete (last line in the spreadsheet for someone with that email address). Issue #3: It still says "doc.pdf" - this may be because the version was not updated yet. |
Done | Done | -- |
|
||
| ITD-8 | update to PDF 5-7-2024 |
Max, please make sure these changes/corrections are made. I ...
Max, please make sure these changes/corrections are made. I sent them earlier but they aren’t done.
This is the latest PDF Design: https://acrobat.adobe.com/id/urn:aaid:sc:us:5ed192b1-eec9-418a-8cb4-526e6623c2d2 This is the report I just got: https://acrobat.adobe.com/id/urn:aaid:sc:us:cae431dd-1e8d-41ec-95b1-d1456f056774 Changes below are also comments in PDF. * *PDF Initial View settings:* * Navigation tab: Bookmarks Panel and Page (latest PDF has bookmarks) * Page layout: Single Page * Magnification: Default * *P. 2 and 3 update as shown on latest PDF*: https://acrobat.adobe.com/id/urn:aaid:sc:us:5ed192b1-eec9-418a-8cb4-526e6623c2d2 * *P. 5 Heading* is "Understanding Your Assessment" * *P. 7 Polar Chart Summary:* Good catch on not being able to have the donut hole since low scores will display there. * Polar Chart colors: * Pusher - Being: #4756CC80 * Pleaser - Boundaried: #2E90B280 * Responsible - Playful: #F28C4A80 * Perfectionist - Messy: #20265965 * Rational - Feeling: #F25B4A80 * Expert - Learner: #64625D80 * Expert - Learner icons and text are reversed. * Character Circle Icons should be in front of chart. They have a white border in case they overlap a chart wedge (see example where Playful is 5). * Character scores can be further away from outer edge or wedge so the circle icons do not obscure them. * *P. 8 Bar chart colors are the same as polar chart colors, add dashed lines at 2.3 and 3.7 behind bars.* * *P. 9 Your Balance Scores: add dashed lines at 2.3 and 3.7 behind bars*. * *P. 11* “You can address overuse…” sentences italicized * *P. 12 Your Answers statements should match latest PDF.* Add space after low balance score paragraph. * *P. 13 “*You can address overuse…” sentences italicized * *P. 14 Your Answers statements should match latest PDF.* Add space after low balance score paragraph. * *P. 15* “You can address overuse…” sentences italicized * *P. 17* “You can address overuse…” sentences italicized * *P. 18 Your Answers statements should match latest PDF*. * *P. 19* “You can address overuse…” sentences italicized * *P. 20 Your Answers statements should match latest PDF*. * *P. 21* “You can address overuse…” sentences italicized * P. 22 Missing buttons at bottom of each column. See latest PDF. Thanks for all your work on this! LMK if you need anything or have questions. I created an alternate vertical layout for mobile in InDesign. The horizontal layout remains the same. But Acrobat allows you to create alternate layouts for different orientations or devices. So if you view the PDF on a laptop you should get the horizontal layout and if you view on mobile, you get the vertical layout with slightly larger fonts and layout optimized for portrait view. This is the InDesign Publish Online report. https://indd.adobe.com/view/5435ea0b-7b0a-422a-a204-74d8e7242ca4 You can download the PDF from InDesign Publish Online link but I exported the PDF as well. https://acrobat.adobe.com/id/urn:aaid:sc:US:90b6ea7d-2483-4770-b769-61ebf2c9864d https://helpx.adobe.com/indesign/using/alternate-layouts-liquid-layouts.html html *Max/Joel:* Just to confirm, here are the remaining fixes: * Ensure that the newest version of the PDF and the client's most recent complete is accessed (and possibly labeled differently than it is currently), * Either ask me to remove the coach email in the url query (at least for testing) or ensure that the client's coach name/email does not yield an error message and stop the download. |
Done | Done | -- |
|
||
| ITD-7 | ability to accept brackets and ignore them if needed |
Client can have a following way to land to the website inclu...
Client can have a following way to land to the website include the \{{ and }} at the end.
please be sure it will accept and you generate the PDF for such queries ----- Tested again: this is what's going through into the redirect: https://report.innerteamdialogue.com/?email=\{{ellenkoronet@lnkcreative.com}}&coach=\{{paul.wyman@innerteamdialogue.com}}/ So it looks like the fields are being properly populated, but the brackets have to be in there to tell involve.me where to put those answers. If I try typing the whole url out without brackets, it doesn't know where the email address ends. I tried it another way and the % signs showed up, but the email still wasn't recognized as valid. Ellen Koronet |
|
Done | Done | -- |
|
|
| ITD-6 | Dynamic text in PDF | Done | Done | -- |
|
|||
| ITD-5 | update the labels on the bar chart ( place on the left side of the bars - see attached pictures) |
Put the character labels to the left along the Y axis left a...
Put the character labels to the left along the Y axis left aligned. Bonus if we can use gradient.
--------- please see the attached images for details |
|
Done | Done | -- |
|
|
| ITD-4 | Illustrator File and a PDF as well as updated report PDF |
Here is the Illustrator File and a PDF as well as updated re...
Here is the Illustrator File and a PDF as well as updated report PDF (making a bunch of minor changes from Paul to copy mostly.
|
|
Done | Done | -- |
|
|
| ITD-3 | Scope of work for this project - Data and Chart Population into Custom PDF Reports |
*Data and Chart Population into Custom PDF Reports*
h4. *Pr...
*Data and Chart Population into Custom PDF Reports*
h4. *Project Overview* This project involves generating a 20-page PDF report using the Laravel framework and a PDF generation library. The report will dynamically incorporate data sourced from Google Sheets, including text information and charts. The primary goal is to automate the creation of personalized reports for each user, enhancing the value and accessibility of the data presented. h4. *Scope of Work* # *PDF Report Generation:* * *Framework:* Utilization of the Laravel framework for backend operations. * *PDF Library:* Implementation of a chosen PDF generation library to create and manipulate PDF files. * *Dynamic Data Insertion:* A dedicated function will be developed to fetch data from Google Sheets and dynamically integrate it into the PDF report. * *Content:* The PDF will include both textual data and charts. The structure and design will be based on an existing PDF file and any additional assets (fonts, Charts.js script) provided by the client. * The PDF report will link to a separate, printable one-page ITD Action Plan provided by the client. # *Chart Integration:* * *Total Charts:* Three distinct charts will be included in the final PDF document. * *Chart 1 - “Your Inner Team”:* Positioned on page 5, detailing aspects of the respondent’s Inner Team. * *Chart 2 - Insiders & Outsiders:* This chart, requiring additional coding, will be placed on page 6 * *Chart 3 - Your Balance Scores:* This chart, requiring intricate coding, will be placed on page 7 # *Additional Features:* * *Lookup Array/Table:* A lookup array/table will be constructed for the chart titled “Your Balance Score.” This feature is intended to enhance the visual distinction of chart objects for end-users, facilitating better understanding and insights. h4. *Time and Cost Estimate* * *Base Estimate:* 12 hours. This estimate covers the generation of the PDF, including dynamic data insertion and the creation of the first chart (“Your Inner Team”). h4. *Deliverables* * *Custom PDF Report:* A 20-page PDF report with dynamically inserted data from Google Sheets. * *Charts:* Three integrated charts within the report offer visual data analysis. * *Documentation:* Basic documentation outlining the functionality and the integration process. *Project Delivery* * *Delivery Timeline:* The project will be delivered within 3 business days from the commencement date. h4. *Assumptions & Risks* * The client will provide the initial PDF file and any necessary assets. * Website hosting (Verixity LLC will provide temporary domain) * All data required for the report is accessible and correctly formatted in Google Sheets. * Any changes to the project scope will be discussed, and adjustments in the cost and delivery timeline may result. * *Aesthetic Enhancements:* Minor non-functional (aesthetic) enhancements requested post-delivery may extend beyond the 3-day delivery window. These are considered outside the initial scope and may incur additional costs. h4. *Acceptance Criteria* * The final PDF report correctly displays all dynamically fetched data. * Charts are accurately rendered and integrated within the specified pages of the report. * The client approves the final deliverable upon review and testing. |
Done | Done | -- |
|
||
| ITD-2 | Google Sheet - for fetching data to generate a dynamic PDF |
Google sheet file:
[https://docs.google.com/spreadsheets...
Google sheet file:
https://docs.google.com/spreadsheets/d/1ztZFBTeidBZkx8Ls6lVAR0n_hYMEfm2s4hrGXJBzMCk/edit Here is the link to the Google Sheet. I am marking up the PDF with cell IDs so you know which fields to pull. https://docs.google.com/spreadsheets/d/1ztZFBTeidBZkx8Ls6lVAR0n_hYMEfm2s4hrGXJBzMCk/edit?usp=sharing I commented fields in PDF which is still being laid out — missing some content. https://acrobat.adobe.com/id/urn:aaid:sc:us:846b2879-e450-4eb4-91c4-37e800dff47d Charts.js fiddles need tweaking. |
|
Done | Done | -- |
|
|
| ITD-1 | create a 2 websites for Laravel ( development and production) |
Proposed urls:
[https://itd-dev.ourdevapps.com/] - for deve...
Proposed urls:
https://itd-dev.ourdevapps.com/ - for development https://itd.ourdeveapps.com - production ---------- Please share the SSH access to Max, Alex & Dima With permissions to run scripts. No database is required for this project. -------- Important: The production will be executed via DNS as https://report.innerteamdialogue.com/ |
To Do | Unresolved | -- |
|

columns (data) change ~15m
change of wording in pdf? need to know how many words and if it will affect other coordinates. It can be 1-2 hours. Depends on what exactly.
---
let us know more specifics
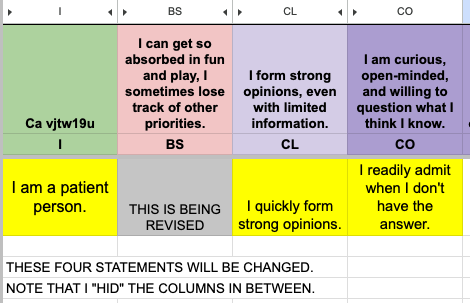
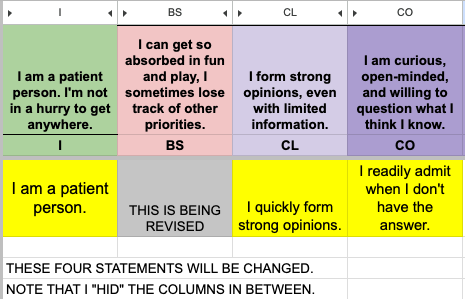
There are four statements that will be changed in two ways:
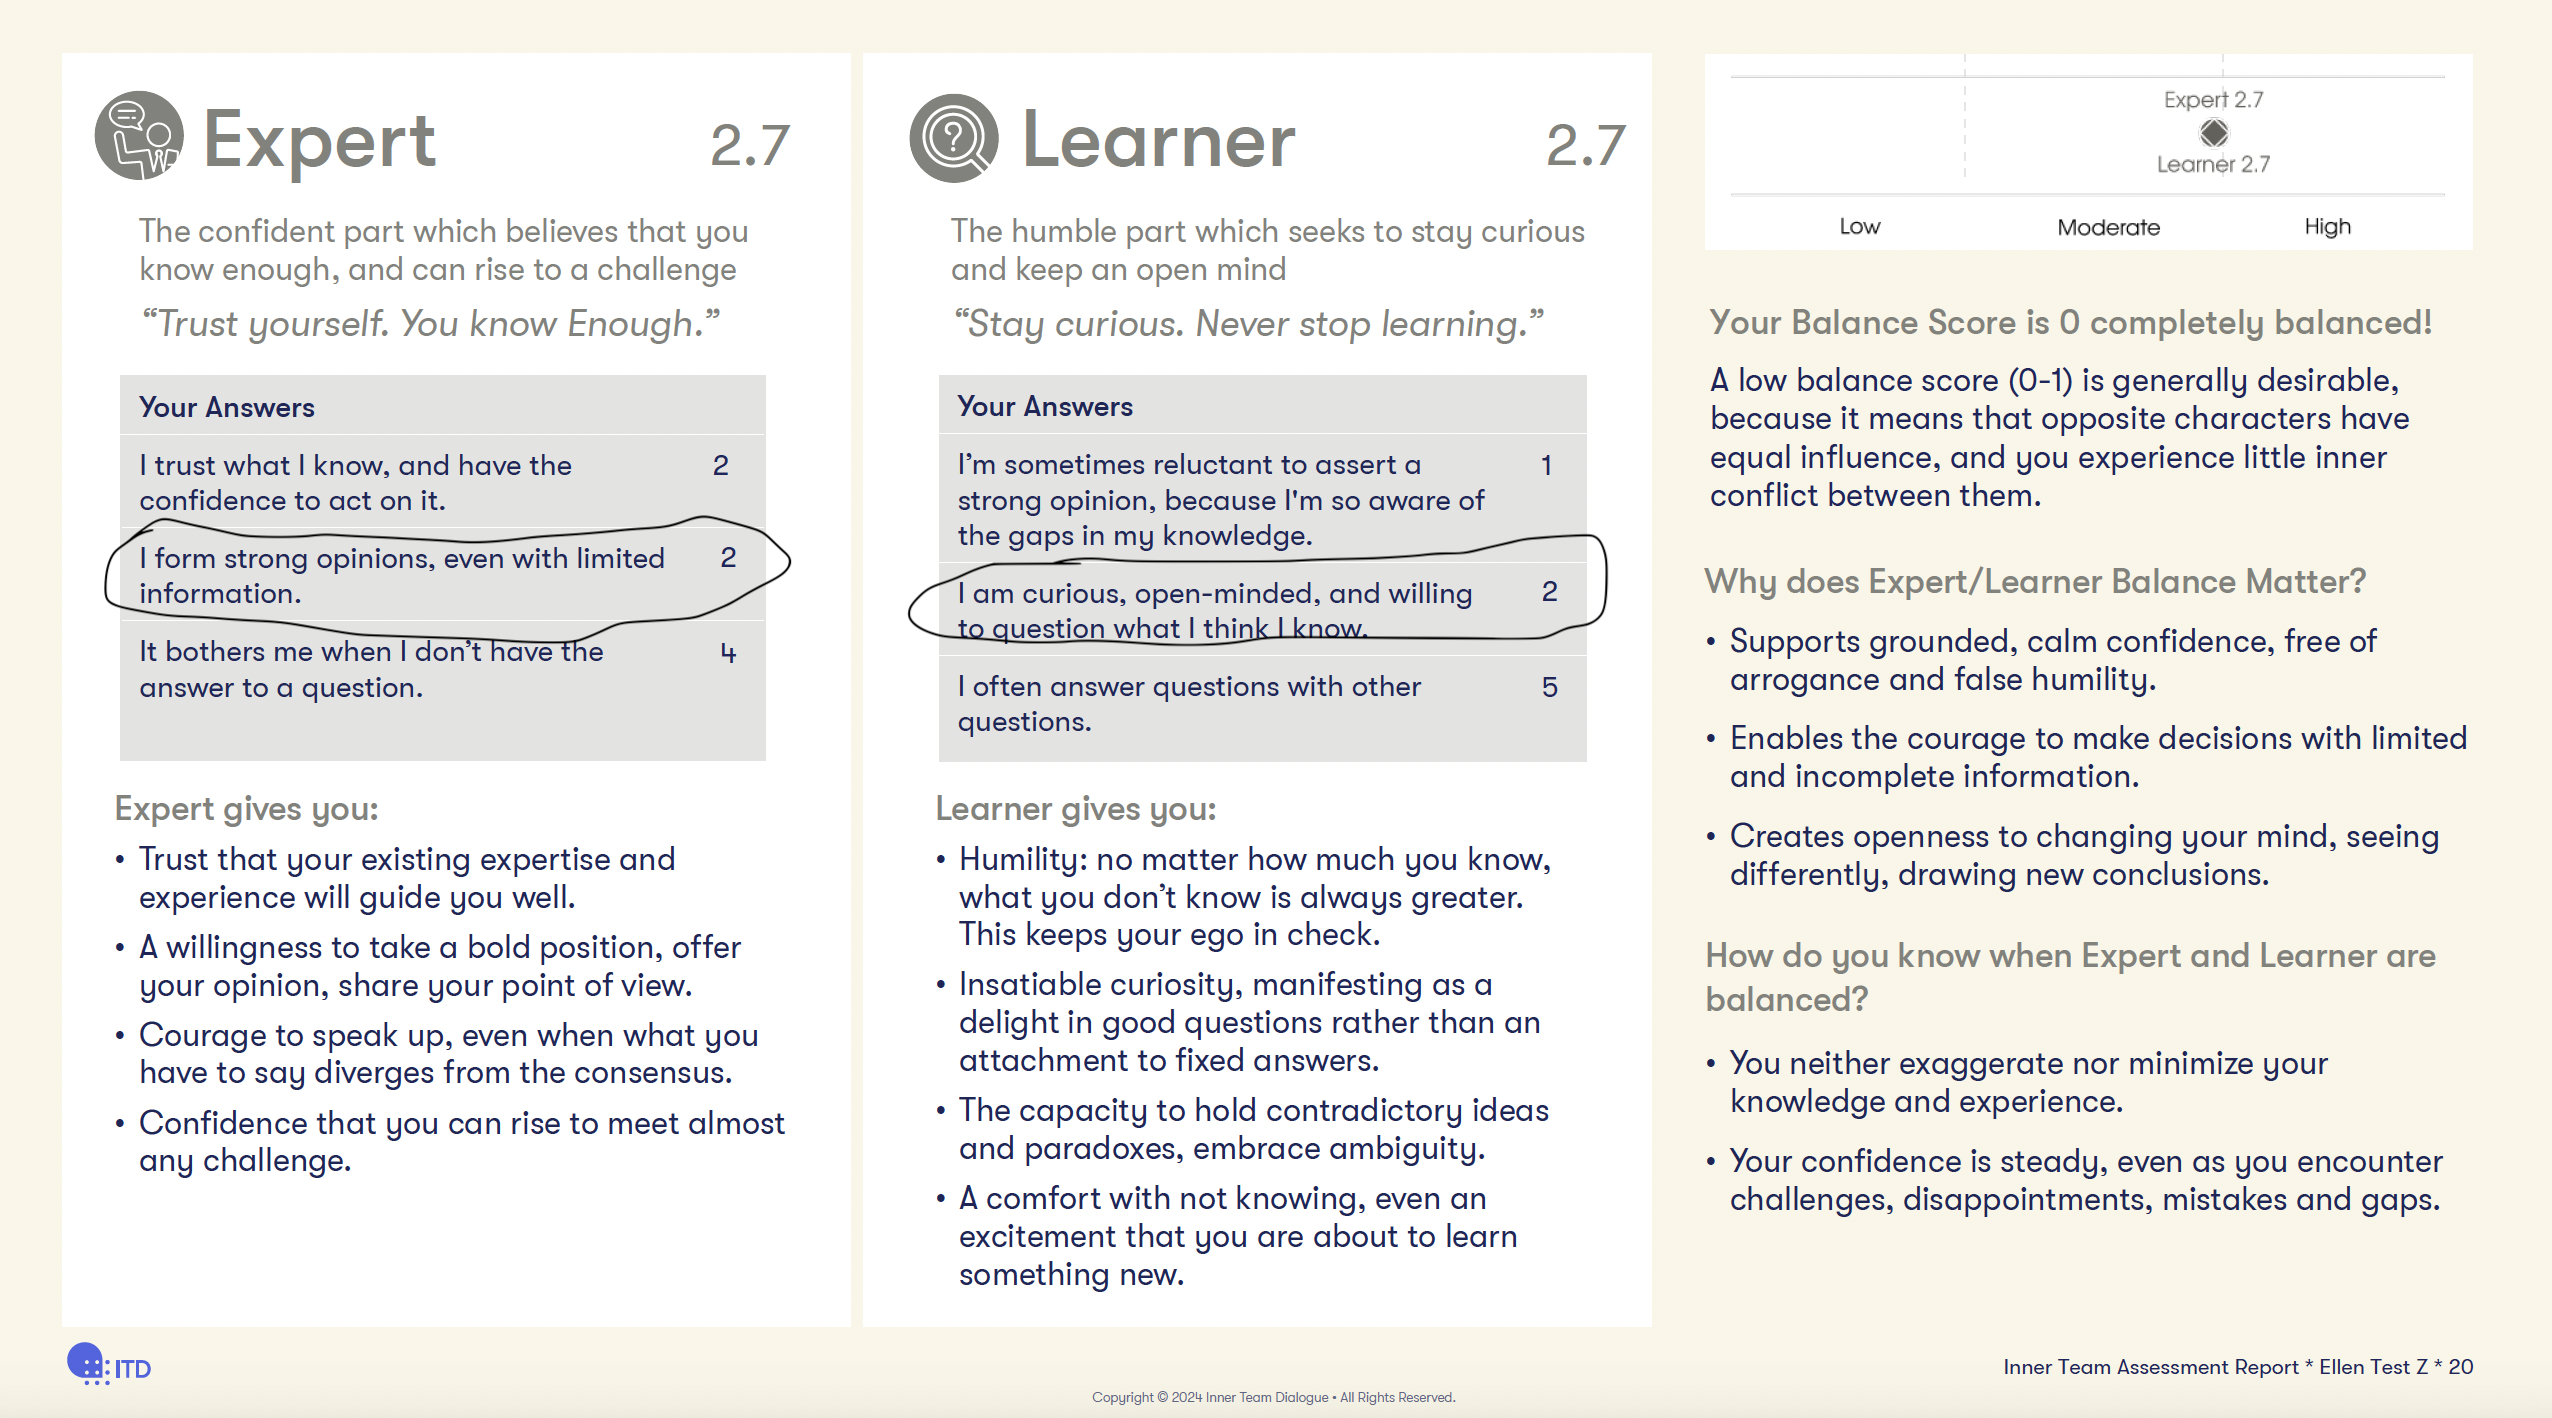
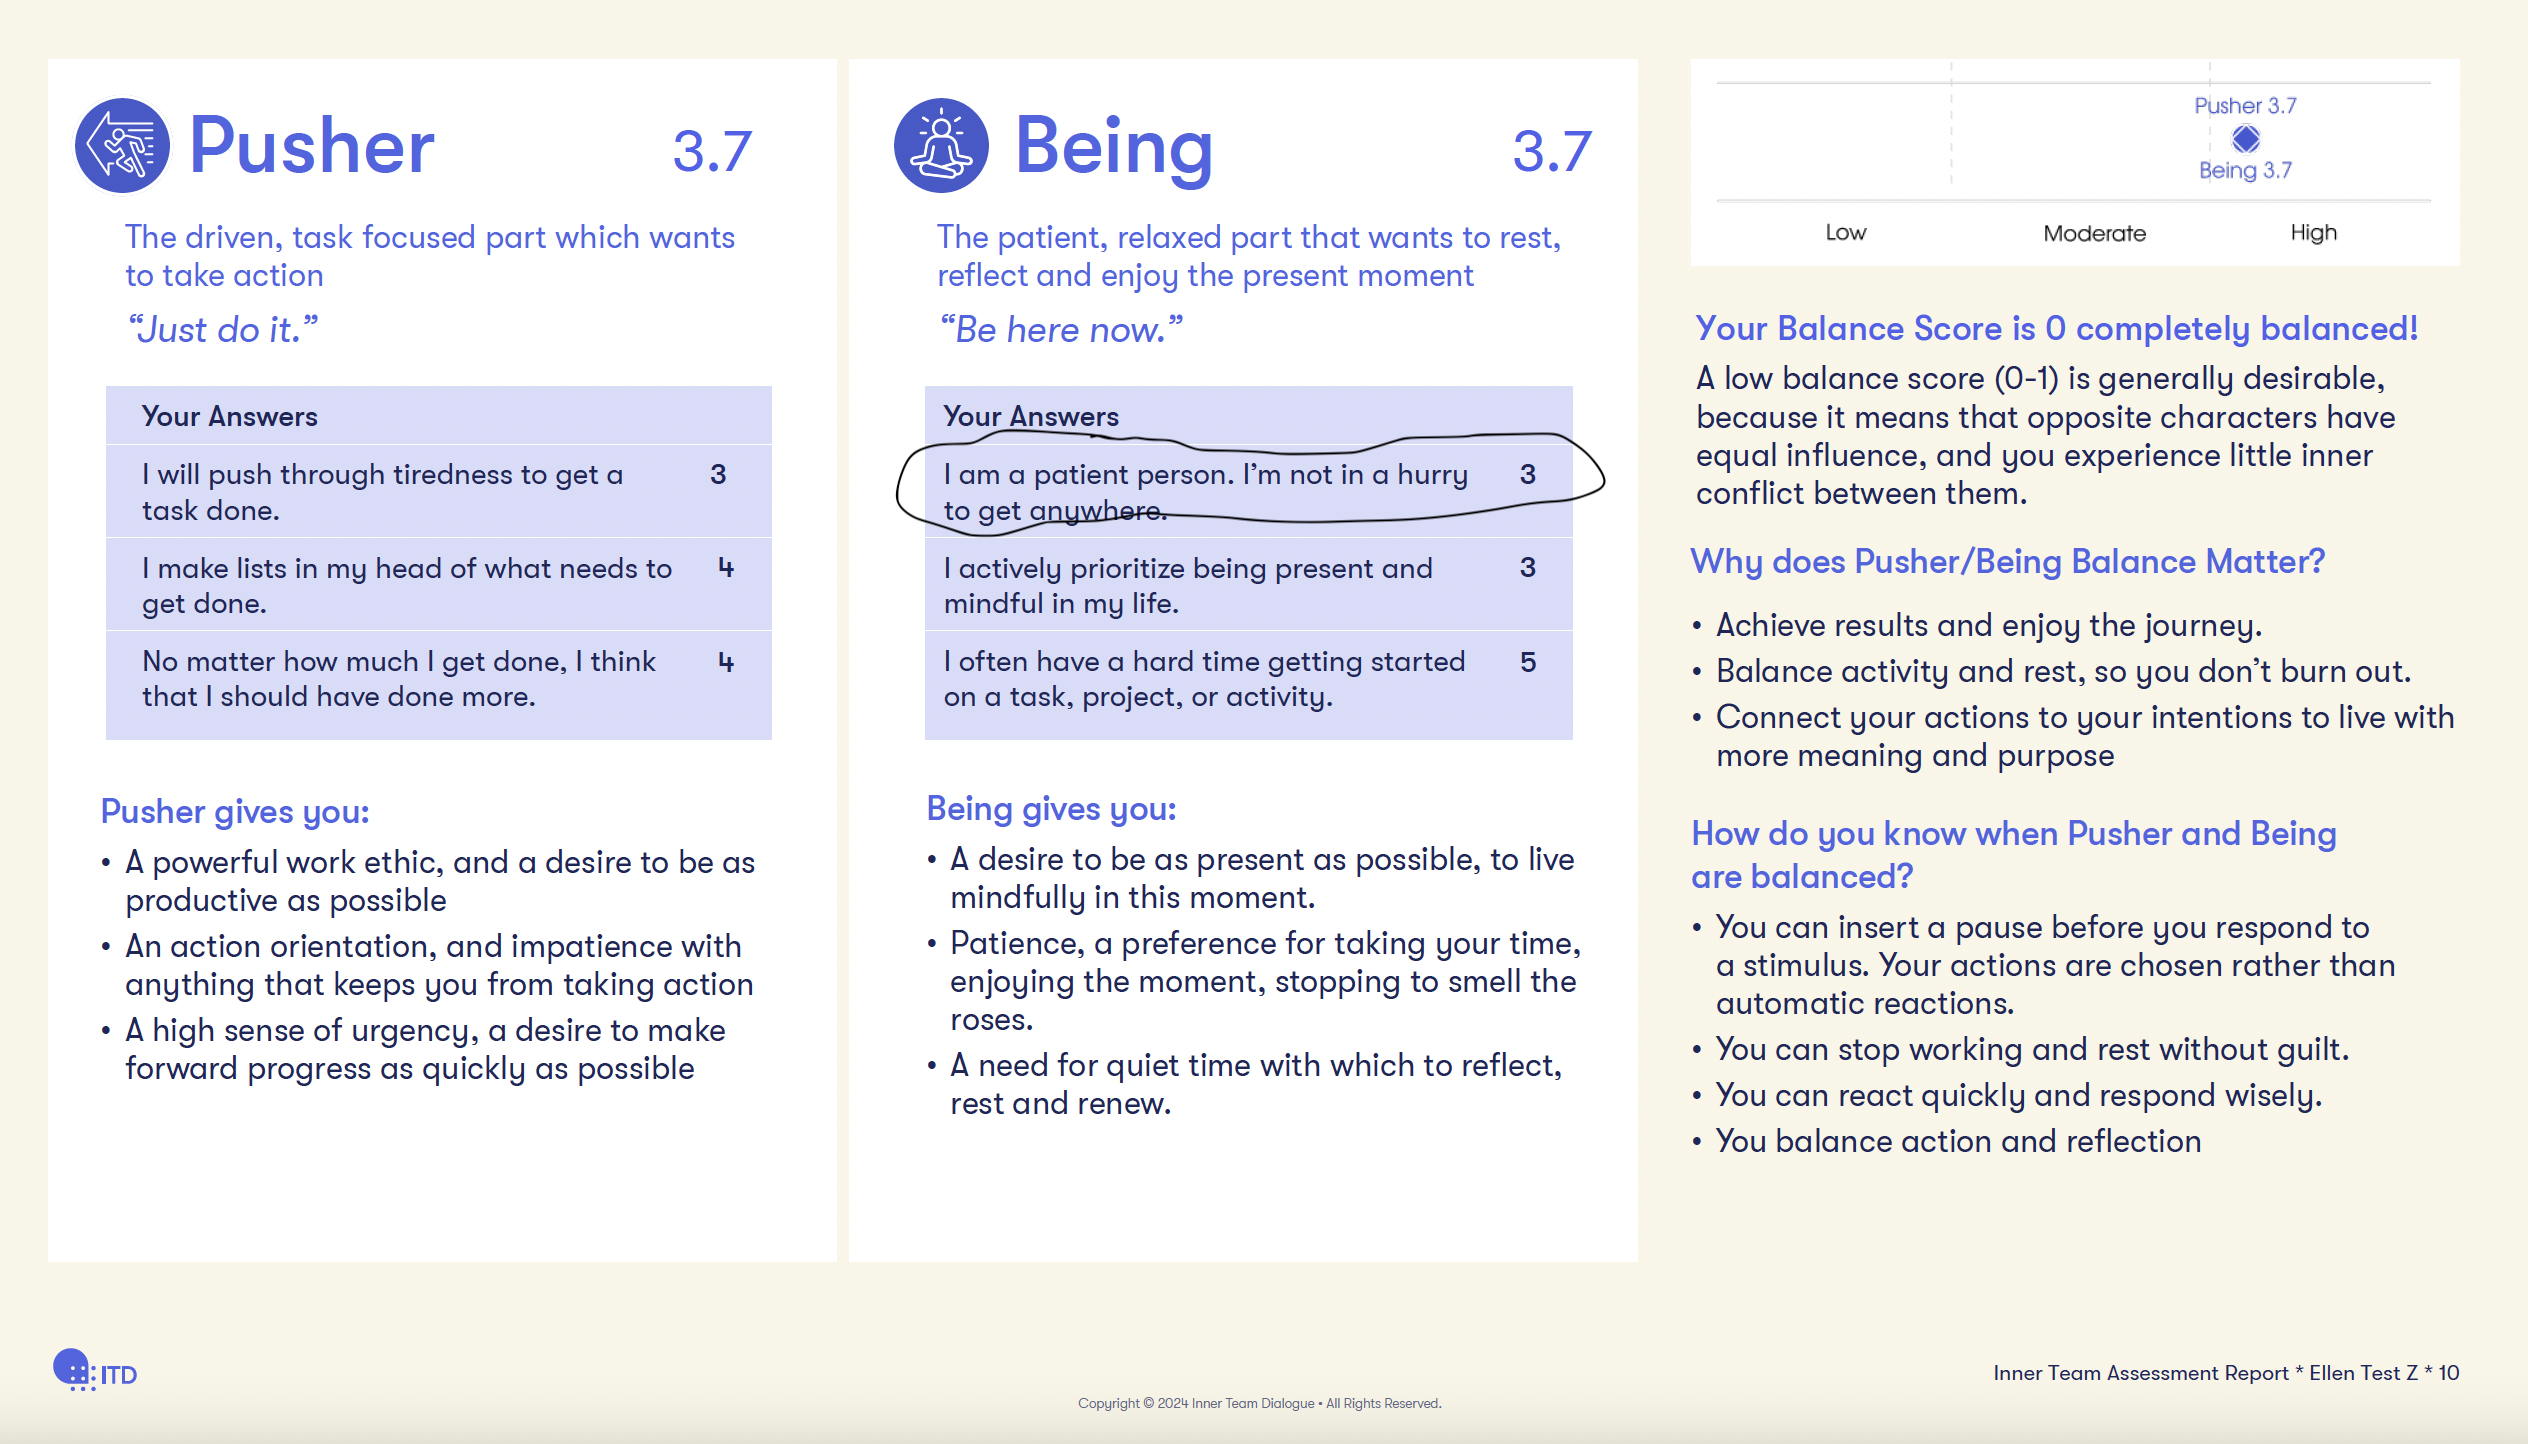
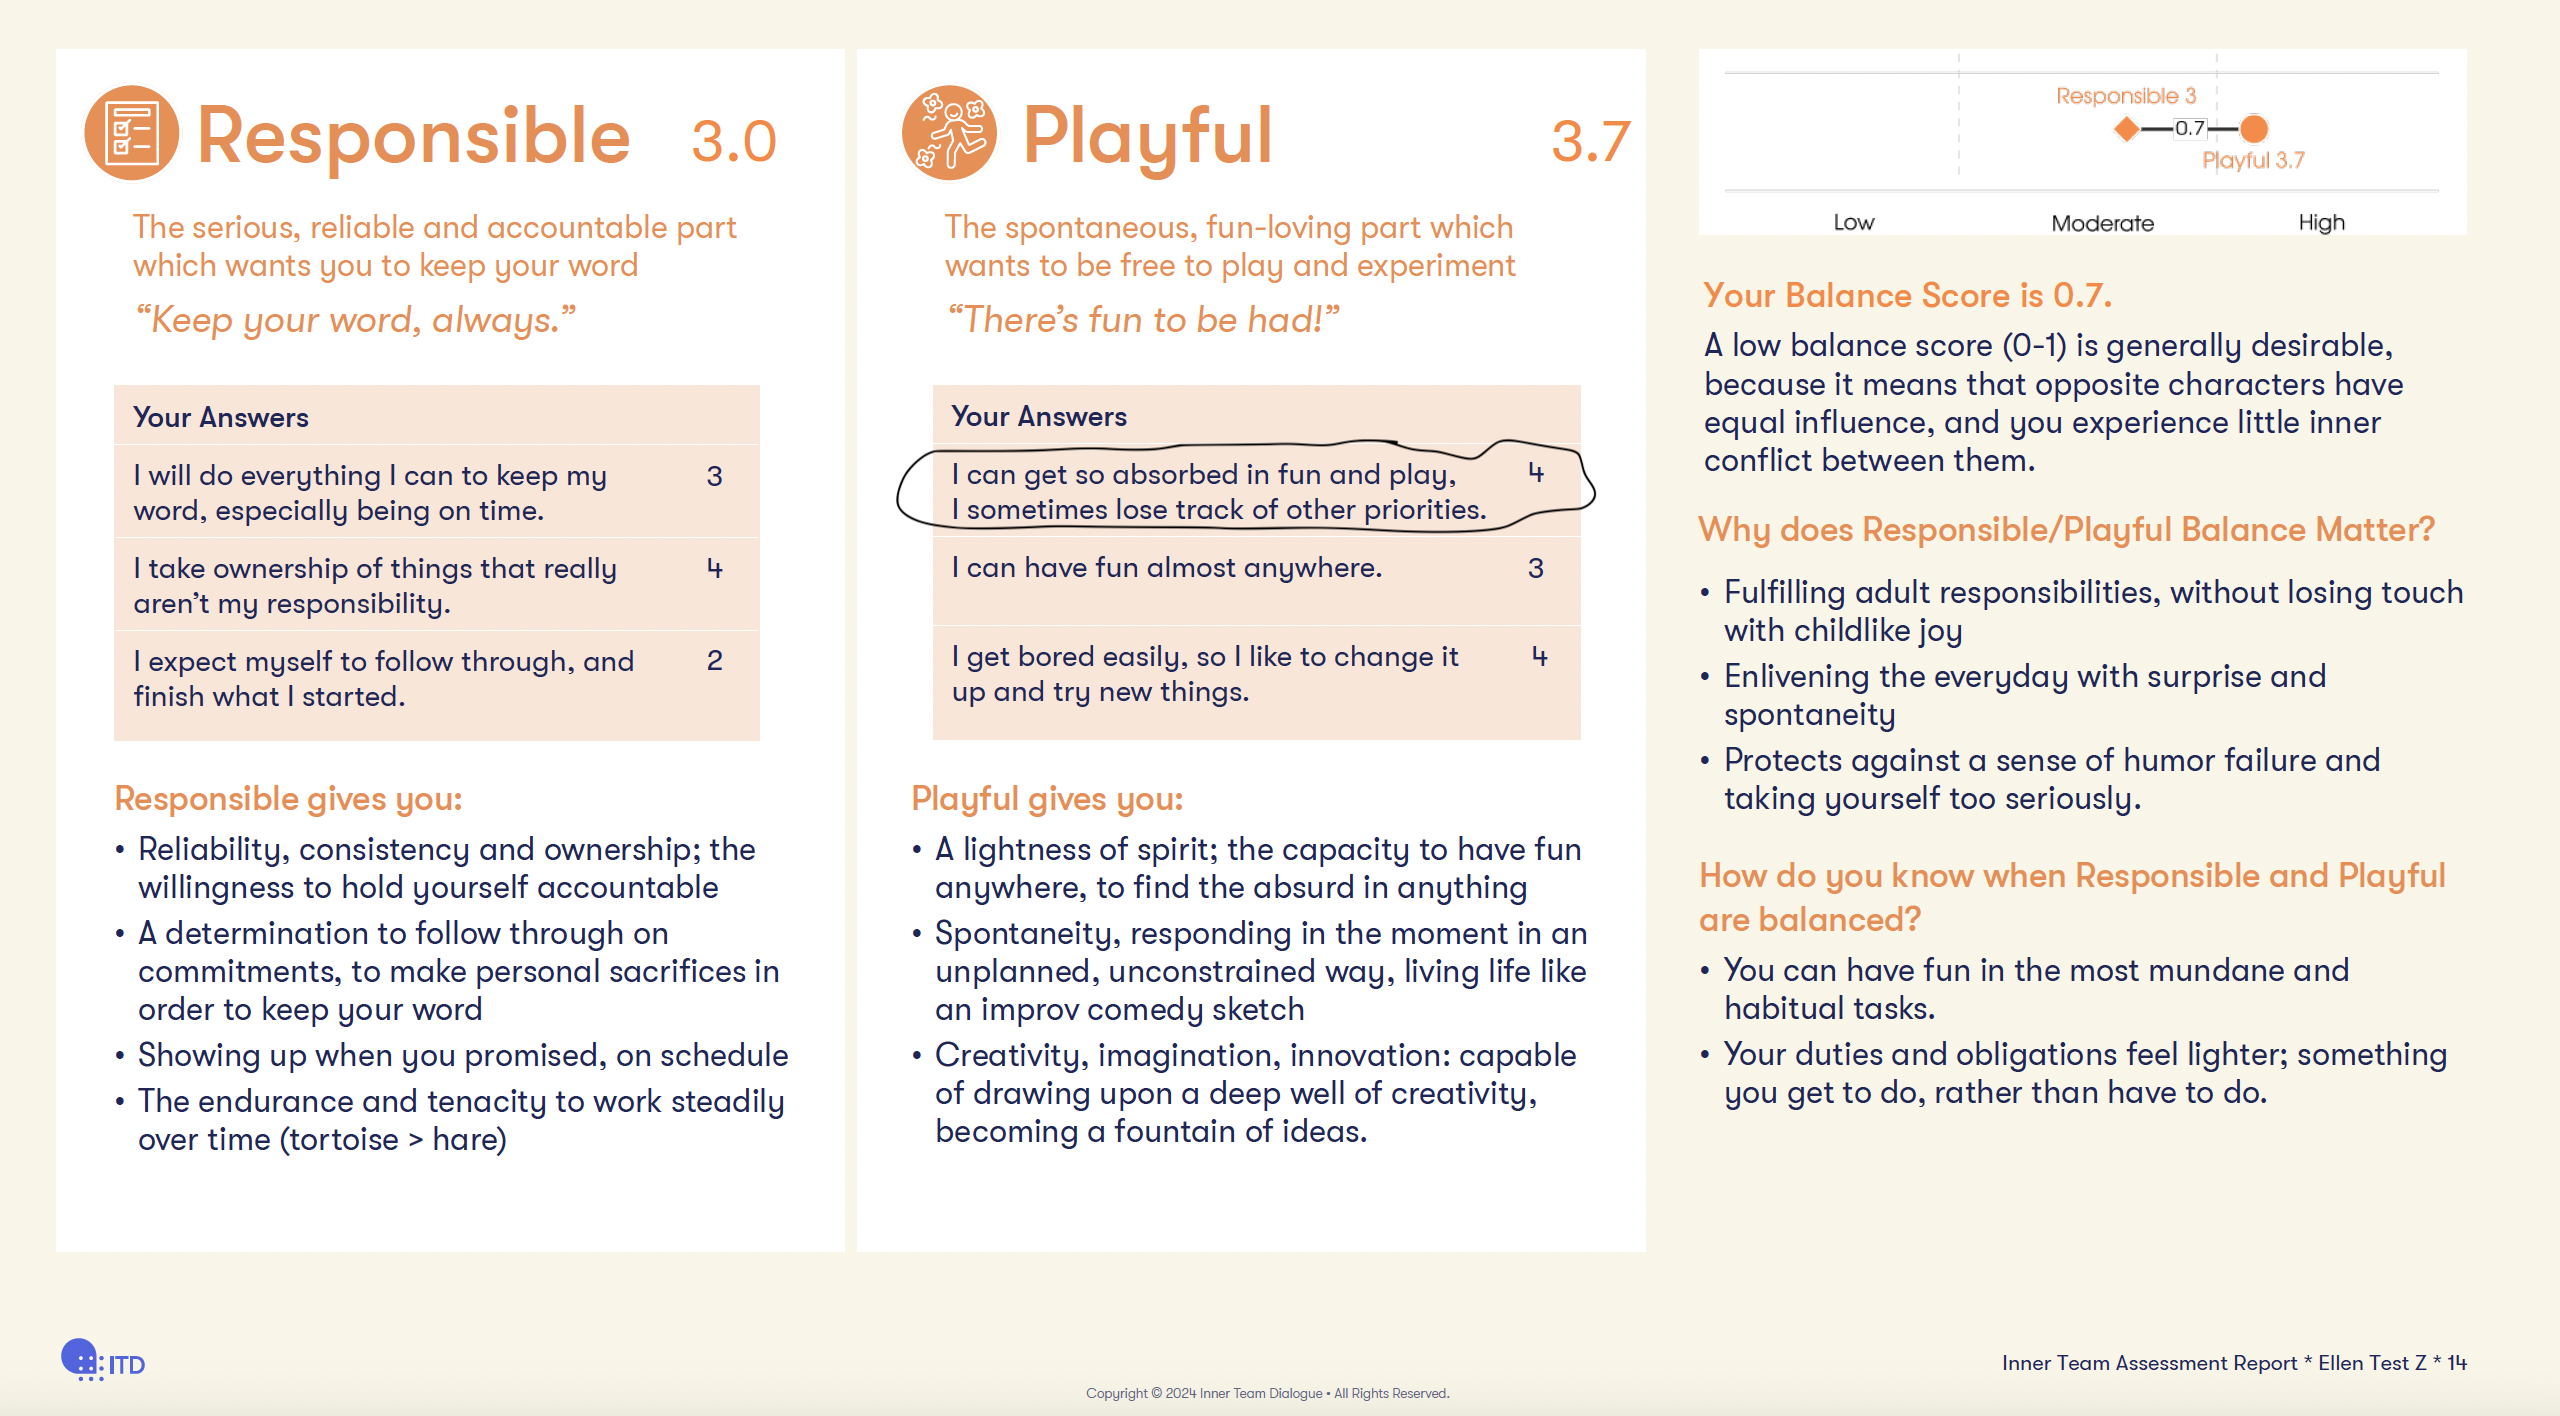
1. In the PDF report, the wording on pages 10, 14, and 20 (see attached screenshots from the pdf. The circled wording will be changed. Two of the four statements are on one page. The new wording of three of them is already set - see attached "new wording" screenshot.
2. The scores for these four statements will now be pulled from new columns in the spreadsheet. The old columns are Columns I, BS, CL, and CO. The old columns will stay in the spreadsheet so I can continue to compare the data.
Once I put the new wording in the assessment itself in involve me, four new columns will appear in the spreadsheet - I don't know which columns they are yet. I believe the headings (calculator codes starting with CA_____) will be the same, so I will change the old column headings so that involve me will find the new columns to populate those scores.
Please let me know how we will move very quickly after I make the changes in involve me - the assessment is LIVE and people are purchasing it, so we cannot have any disruption.
This is the sequence:
1. I give you the new wording (The attached "new wording" screenshot has 3 of the 4 statements already. We are finalizing one of these).
2. You create the changes for me to proof (in development mode).
3. I approve the changes and create the new columns in the spreadsheet by changing the assessment.
4. VERY QUICKLY, you point the four new scores to the right places and turn the new PDF on.
Expert-learner-p-20-two-changes.png Pusher-being-p-10-one-change.png Responsible-playful-p-14-one-change.png new-wording.png